Electricity-related emissions vary significantly across space and time, driven by local generation, grid constraints, weather conditions, and consumption patterns.
National or annual average carbon intensities smooth out these variations, obscuring when electricity consumption is effectively supplied by nearby low-carbon generation.
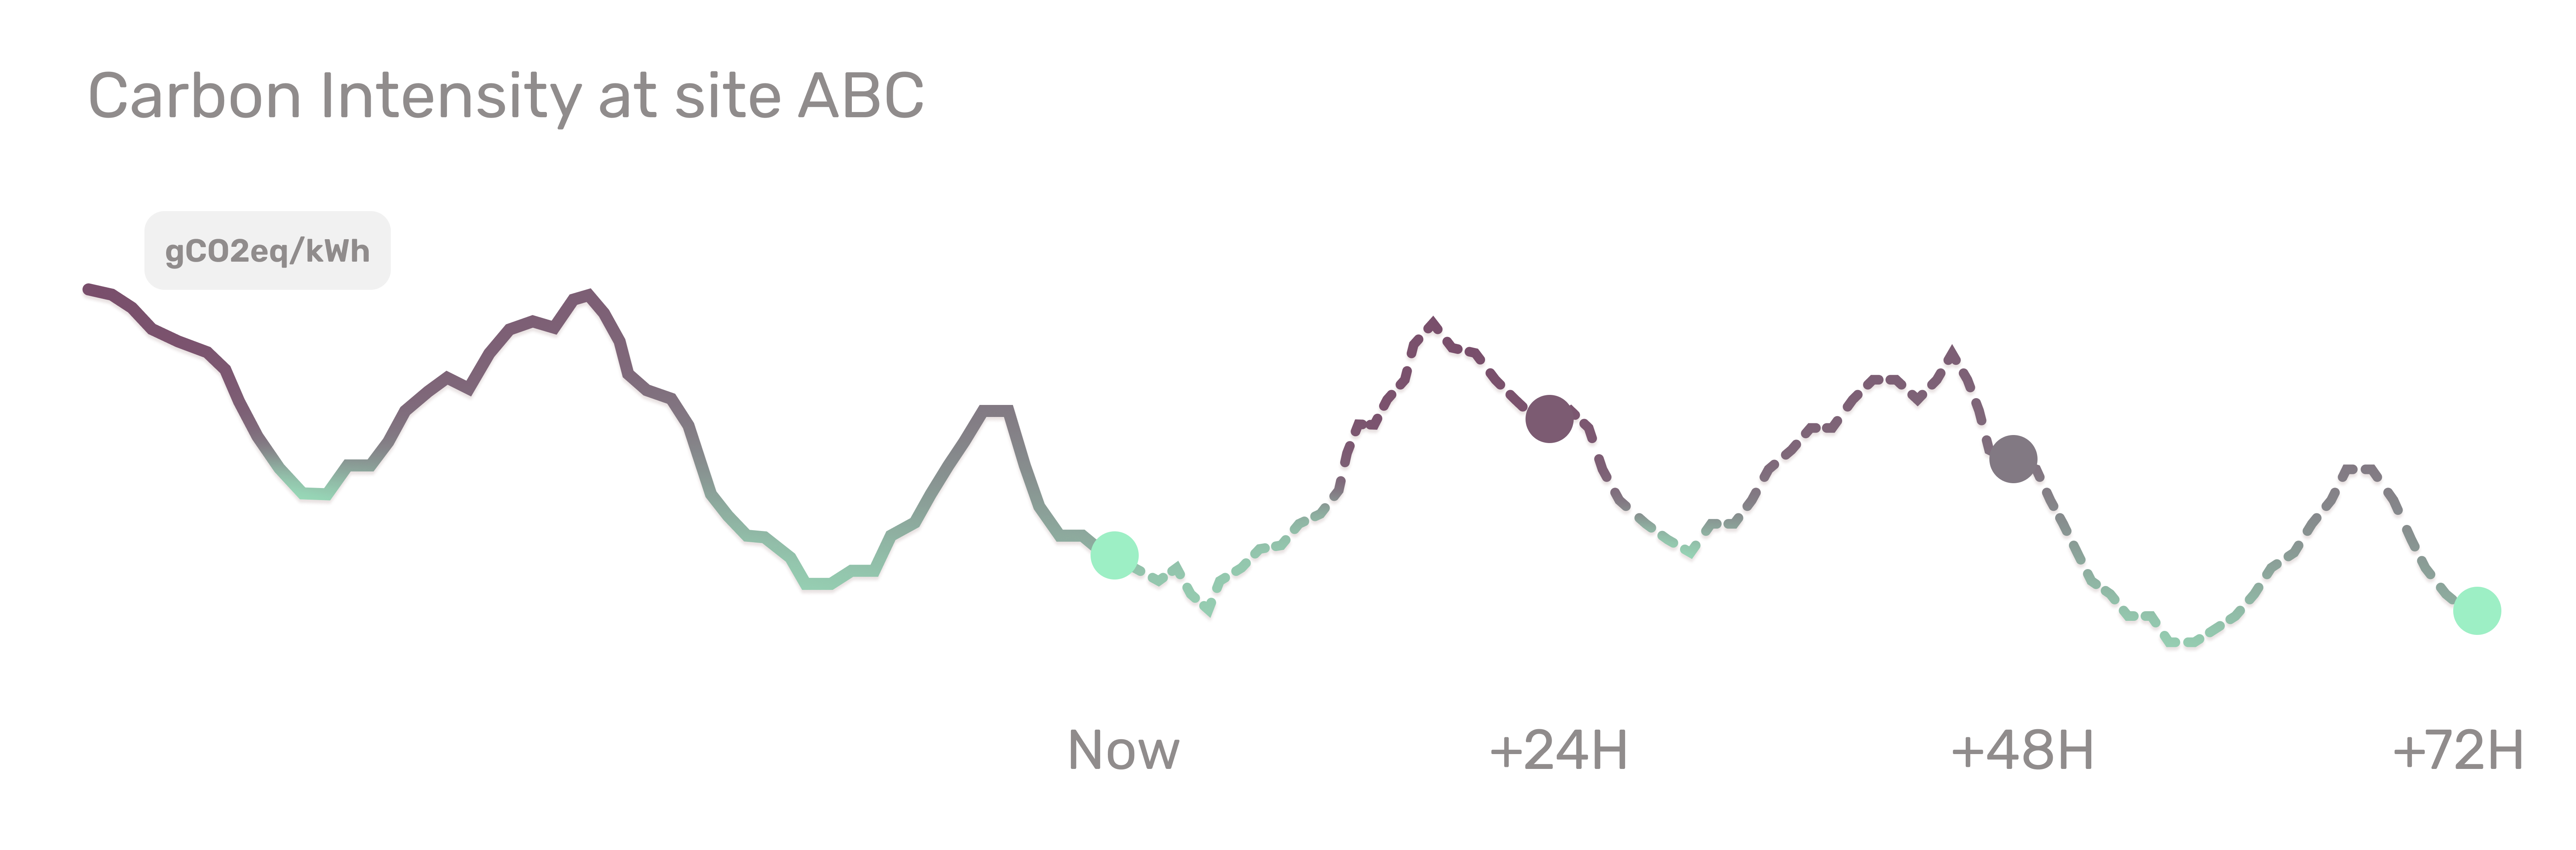
Local, hourly carbon intensity signals make these dynamics visible. By modeling how electricity flows through the grid over time, they reveal periods when renewable energy is available locally but not fully consumed.
Identifying these windows enables businesses to align consumption with low-carbon electricity and, when combined with appropriate contract structures, translate this alignment into economic value - without requiring investments into physical infrastructure.

Substation-level carbon intensity
Models physical grid constraints
Reflects electricity actually consumed

Hourly local carbon signals
Anticipates local renewable variability
Supports short-term planning

Designed for Scope 2
Aligned with hourly matching
Stable, auditable methodologies

Nodera’s models combine grid topology, local electricity generation, weather data, and historical consumption patterns. Together, these inputs describe both the physical structure of the power system and the factors that influence how electricity is produced and consumed over time.
These inputs are combined through electricity flow modeling to estimate how power is distributed across the grid at each hour. This approach captures spatial constraints and temporal variability, reflecting how local generation interacts with the wider power system.
The signal is defined at the level of the area supplied by a substation: the closest representation of the electricity mix delivered to end consumers. This granularity supports site-level carbon accounting with clear geographic attribution.